Tuesday, December 18, 2007
Selected Statistic Sampling
by Jes
A look around the NHL at a hodge podge of statistical odds and sods.
I don't believe in the "Great player on a crappy team" argument for awarding the Hart Trophy (MVP), but one can certainly see just how valuable Alexander Ovechkin is to the (mis)fortune of the Washington Capitals.
19% - The percentage of Washington shots have come off of the stick of Ovy.
27% - 24 of the 88 Capital goals have been scored by Ovechkin. No surprise.
44% - Add in his assists, and Ovechkin has had a hand in 39 of the 88 Capitals' goals. Almost half!
+4 - Yep, Alex has the best +/- figure on the team, and is just one of four players to be on the positive side of the ledger.
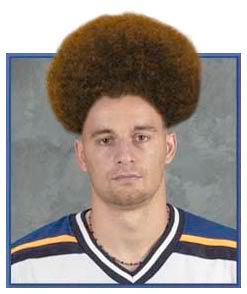
Cy Young Award Nominee: Brad Boyes, the talented young St. Louis Blues forward with 19 goals and 9 assists in 30 games. Even since being move to the wing, he's been more selfish (in a good way) and productive.
A real plus: Dany Heatley leads the NHL with a whopping +27, eight better than runner-up Nick Lidstrom.
Patrick Sharp-shooter: Patrick Sharp (who?), the Blackhawks forward, has been one of the NHL's unsung heroes this season with 25 points in 30 games. His career high prior to this season? 35 points. The most interesting thing is that Patrick Sharp has FIVE shorthanded goals so far this season, and is on pace to break double digits. Yowsa!
Speaking of shorties, only the Florida Panthers and Carolina Hurricanes have yet to score a shorthanded goal this season. While the Panthers' PK has been solid, the Hurricanes can add insult to that injury be also having the worst PK unit in the league, killing penalties at a putrid 75.3%.
What's the biggest +/- disparity on a single team? I look and see the Red Wings have one of 26 with Nick Lidstrom sitting at +18 and Dallas Drake sitting at -8. The St. Louis blues have one of 23, with Eric Brewer at +10 and Barret Jackman at -13. Of course, the above mentioned Dany Heatley and any Senator at -1 is a disparity of 28, but that feels like cheating.
A look around the NHL at a hodge podge of statistical odds and sods.
19% - The percentage of Washington shots have come off of the stick of Ovy.
27% - 24 of the 88 Capital goals have been scored by Ovechkin. No surprise.
44% - Add in his assists, and Ovechkin has had a hand in 39 of the 88 Capitals' goals. Almost half!
+4 - Yep, Alex has the best +/- figure on the team, and is just one of four players to be on the positive side of the ledger.
Labels: Alexander Ovechkin, Brad Boyes, statistics


Tuesday, July 31, 2007
Some Summer Stat Hunting
by Jes
With James Mirtle (whose ass I am going to kick in online Scrabble) going on a bit of a stats-posting binge, I'll jump in with a few bits and bites of my own.
DOING IT THE HARD WAY
---------------------
Scoring points at even strength and short-handed is a LOT harder than scoring on the Power Play. There were 4 players with 20+ points that scored nary a single point on the man advantage. The winner? Bates Battaglia, the comeback kid who scored all 31 of his regular season points at even strength. Samuel Pahlsson, the defensive god, was second, and his buddy Rob Niedermayer was also an all-even-strength kind of guy with 16pts.
POWER PLAY SPECIALISTS
----------------------
Just who relies on the Power Play for their offence? Guys like these tend to rack up more points in the long run because they get the good ice time. I wouldn't count on Battaglia to do so well in 2008.
Not surprisingly, most of the top gunners are defensemen, as they hold back during even strength, and then get the chance to let loose with the man-advantage.
Among forwards, greedy Michael Ryder, he of the 1-year contracts, was the most 'enhanced' forward, with 34 of his 58 points (58.6%) coming on the Power Play.
THE CRAIG LUDWIG AWARD
----------------------
Anton Volchenkov led the NHL with 273 blocked shots, 45 more than second place Jason Smith, who had 228. Niclas Havelid was a surprise third place with 225.
Among forwards, the winner was ... Blair Betts??!! with 98, good for 101st place overall.
A RETURN TO THE 84-GAME SEASON?
-------------------------------
If you saw a lot more of Sean Avery than you wanted to, blame the schedule maker and his trade to the Rangers. Avery led the NHL with 84 games played, 2 more than the 82 scheduled.
HERE'S A GIFT FOR YOU
----------------------
Jaromir Jagr, who hogs the puck as much as anyone to ever play the game, led the league with 126 giveaways. Jason Smith had the dubious honour of finishing second with 109. Now, I understand why Jagr would have a lot, but Smith? When your defensive stalwart is giving away pucks like that, you are in serious doo-doo.
ROD BRIND'AMOUR = FACE-OFF KING
-------------------------------
We all know Rod "the Bod" Brind'Amour is great on face-offs, and the stats bare out his mastery.
# of face-offs taken = 2047, almost 300 more than second place Mats Sundin
% of team face-offs taken = 43.6% (Second place was Sundin at 37.5%)
% of face-offs won = 59.2%, second only to Yanic Perreault, who was his usual deadly self with 62.8% (!) of draws won.
With James Mirtle (whose ass I am going to kick in online Scrabble) going on a bit of a stats-posting binge, I'll jump in with a few bits and bites of my own.
DOING IT THE HARD WAY
---------------------
Scoring points at even strength and short-handed is a LOT harder than scoring on the Power Play. There were 4 players with 20+ points that scored nary a single point on the man advantage. The winner? Bates Battaglia, the comeback kid who scored all 31 of his regular season points at even strength. Samuel Pahlsson, the defensive god, was second, and his buddy Rob Niedermayer was also an all-even-strength kind of guy with 16pts.
PLAYER           POINTS    EVEN-STRENGTH %
Bates Battaglia     31          100%
Samuel Pahlsson     26          100%
D. Afanasenkov      21          100%
Dan Hamhuis         20          100%
POWER PLAY SPECIALISTS
----------------------
Just who relies on the Power Play for their offence? Guys like these tend to rack up more points in the long run because they get the good ice time. I wouldn't count on Battaglia to do so well in 2008.
Not surprisingly, most of the top gunners are defensemen, as they hold back during even strength, and then get the chance to let loose with the man-advantage.
PLAYER          POINTS       PPP%
Rob Blake          34        76.5
Sheldon Souray     64        75.0
Sergei Zubov       54        74.1
Tom Poti           44        72.1
Among forwards, greedy Michael Ryder, he of the 1-year contracts, was the most 'enhanced' forward, with 34 of his 58 points (58.6%) coming on the Power Play.
THE CRAIG LUDWIG AWARD
----------------------
Anton Volchenkov led the NHL with 273 blocked shots, 45 more than second place Jason Smith, who had 228. Niclas Havelid was a surprise third place with 225.
Among forwards, the winner was ... Blair Betts??!! with 98, good for 101st place overall.
A RETURN TO THE 84-GAME SEASON?
-------------------------------
If you saw a lot more of Sean Avery than you wanted to, blame the schedule maker and his trade to the Rangers. Avery led the NHL with 84 games played, 2 more than the 82 scheduled.
HERE'S A GIFT FOR YOU
----------------------
Jaromir Jagr, who hogs the puck as much as anyone to ever play the game, led the league with 126 giveaways. Jason Smith had the dubious honour of finishing second with 109. Now, I understand why Jagr would have a lot, but Smith? When your defensive stalwart is giving away pucks like that, you are in serious doo-doo.
ROD BRIND'AMOUR = FACE-OFF KING
-------------------------------
We all know Rod "the Bod" Brind'Amour is great on face-offs, and the stats bare out his mastery.
# of face-offs taken = 2047, almost 300 more than second place Mats Sundin
% of team face-offs taken = 43.6% (Second place was Sundin at 37.5%)
% of face-offs won = 59.2%, second only to Yanic Perreault, who was his usual deadly self with 62.8% (!) of draws won.
Labels: jes is bored, statistics
Saturday, April 07, 2007
Celebrating the Best of the NHL's Worst
by Jes
 The NHL's best and brightest stars get lots of press, adoration, and their share of the league's awards.
How about the worst of the lot? How about a little bit of attention for these poor folks? I'm sure, after having such poor seasons, that these d00d's need a little love, too.
So, here are the 'best' of the worst:
+/-
R.J. Umberger -30
Joffrey Lupul -28
Patrice Bergeron -27
Kyle Calder -27
Shot %
Stephane Robidas 0% (104 shots)
Niklas Kronvall 0% (104 shots
Martin Skoula 0% (90 shots)
Steve Montador 1.1% (87 shots
Missed Shots
Simon Gagne 174
Alexander Ovechkin 145
Ilya Kovalchuk 135
Olli Jokinen 134
Brian Rolston 134
Save Percentage
Marc Denis 88.3%
Mikael Tellqvist 88.5%
Alexander Auld 88.8%
Curtis Sanford 88.9%
Brent Johnson 88.9%
Average Time on Ice (40+ games)
Andrew Peters 3:41
Brian McGrattan 3:51
Cam Janssen 4:05
Andre Roy 4:25
Derek Boogaard 4:33
Face-Off %
Evgeni Malkin 43.1%
Olli Jokinen 44.1%
Maxime Talbot 44.5%
Eric Staal 44.8%
Jeff Carter 45.2%
Giveaways
Jaromir Jagr 123
Jason Smith 108
Bryan McCabe 104
Robert Lang 103
Joe Thornton 100
Cross-Posted on The Fanhouse
The NHL's best and brightest stars get lots of press, adoration, and their share of the league's awards.How about the worst of the lot? How about a little bit of attention for these poor folks? I'm sure, after having such poor seasons, that these d00d's need a little love, too.
So, here are the 'best' of the worst:
+/-
R.J. Umberger -30
Joffrey Lupul -28
Patrice Bergeron -27
Kyle Calder -27
Shot %
Stephane Robidas 0% (104 shots)
Niklas Kronvall 0% (104 shots
Martin Skoula 0% (90 shots)
Steve Montador 1.1% (87 shots
Missed Shots
Simon Gagne 174
Alexander Ovechkin 145
Ilya Kovalchuk 135
Olli Jokinen 134
Brian Rolston 134
Save Percentage
Marc Denis 88.3%
Mikael Tellqvist 88.5%
Alexander Auld 88.8%
Curtis Sanford 88.9%
Brent Johnson 88.9%
Average Time on Ice (40+ games)
Andrew Peters 3:41
Brian McGrattan 3:51
Cam Janssen 4:05
Andre Roy 4:25
Derek Boogaard 4:33
Face-Off %
Evgeni Malkin 43.1%
Olli Jokinen 44.1%
Maxime Talbot 44.5%
Eric Staal 44.8%
Jeff Carter 45.2%
Giveaways
Jaromir Jagr 123
Jason Smith 108
Bryan McCabe 104
Robert Lang 103
Joe Thornton 100
Cross-Posted on The Fanhouse
Labels: NHL, RJ Umberger, statistics
Thursday, February 15, 2007
A look-see at the NHL's Goaltenders
Now that we're 2/3rd done the season, I feel the need to analyze some of the goaltenders in the league as we head into the stretch run.
Martin Brodeur - (55GP 35-15-5, 2.07GAA, 92.7%)
I've been oft-critical of Martin Brodeur, the goaltender with the golden horseshoe up his arse. While he has always piled up the big win totals and made the most out of great situations, he's rarely ever been among the true top 3 in the league in any one season. He's got a nice Vezina replica on his trophy shelf, but it wasn't really deserved.
This season? He's actually got an amazing case for the Vezina, and has truly never played better. He's second in the league with a 92.7SV%, first in shutouts with 10(!), first in wins (35), and first in GAA with 2.07.
He's faced 27.89 shots per 60 minutes, which is a much higher rate than what's he has been used to in past years, and has kept the Devils on a successful path despite many roster deletions over the past couple of seasons.
I'll give him his props, he definitely is Vezina-worthy this season.
Roberto Luongo - (54GP 32-18-3, 2.34GAA, 92.1SV%)
At the start of the season, Luongo was really struggling and was definitely not the "Luongod" we expected. Fortunately, the fans here were willing to cut him some slack (very rare for any goaltender) and supported Luongo through his adjustment period. I guess the fans (as I did) figured Luongo would find himself eventually, and he certainly did.
I don't often pump goalies for the MVP, but Luongo has a great case based on the "Most valuable to his team" argument. No goalie has faced more shots on goal this year (1553, 29.60 per 60 minutes), and no goalie has had quite the profound effect on his team, not even Brodeur. Want to know where the Canucks would be with Dan Cloutier back in net? Sniffing the Blue Jackets' asses like a dog.
---
Sometimes, the best laid plans go to waste, and a backup goalie ends up supplanting the "#1" and doing a much better job.
OTTAWA
Ray Emery: 41GP 24-13-2, 2.40GAA, 92.3SV%
Martin Gerber: 21GP 9-9-1, 2.92GAA, 90.4SV%
...and this isn't the first time Gerber has been usurped. You'd think Ottawa would have looked at Gerber's real numbers from last year before shelling out millions....
COLORADO
Peter Budaj: 35GP 17-13-3, 2.67GAA, 90.9SV%
Jose Theodore: 27GP 10-12-1, 3.30GAA, 89.2SV%
As a Canucks fan, I'm quite happy that the Colorado Avalanche were dumb enough to dress the shell-shocked Theodore so often to justify his large salary. If the Avs played Budaj more than they have, they'd likely be in a playoff spot.
---
The best true tandem? That would be the Nashville Predators. When Tomas Vokoun went down with a long-term injury earlier this season, there was much panic in the land that produces really bad "country" music.
Instead, Chris Mason came in and did an ever better job than Vokoun. Given Mason's numbers from last season, it's not a huge surprise...
Chris Mason: 33GP, 21-9-2, 2.35GAA, 92.7SV%
Tomas Vokoun: 27GP, 18-7-1, 2.38GAA, 92.1SV%
---
Who has the easiest goaltending job in the NHL? That would be Dominik "Smoker's Teeth" Hasek, who faces a measly 22.53 shots per 60 minutes. He has the very shiny wins (30), GAA (2.08), and gets a load of positive press. What the press doesn't seem to notice is his league-average 90.8SV%.
Still, the Wings are doing the smart thing by keeping Hasek from getting fatigued and tearing up his groin during the season. All the Wings need is for Hasek to 'be there' when the playoffs start.
---
Sometimes, a good offence isn't enough...
Q: What do the Carolina Hurricanes, Atlanta Thrashers, and Tampa Bay Lightning all have in common?
A: Great goal scoring and crappy goaltending! All 3 teams have littered the scoring leaderboards with offensive firepower (Whitney, St. Louis, Lecavalier, Hossa, Kovalchuk, etc...), and are struggling to achieve a great deal of success.
The Hurricanes rank 8th in goals for and 22nd in goals against.
The Lightning rank 10th in goals for 20th in goals against
The Thrashees rank 11th in goals for and 25th in goals against.
Somehow, the Tampa Bay Lightning thought that bringing in a guy who could barely handle the #1 duties for the Columbus Blue Jackets would be the solution to their goaltending problems. Huh??!?! Well, he didn't work out so well, so they got some generic Swedish guy to take over...
Marc Denis: 30GP 11-13-2, 3.15GAA, 88.0SV% (2nd worst)
Johan Holmqvist: 33GP 21-11-10, 2.64GAA, 90.1SV% (Winning despite a poor SV%)
The Carolina Hurricanes were smart to let the Sens overpay for Martin Gerber, but fooled into thinking Cam Ward could handle the #1 duties.
While his cup ring will earn Ward a LOT of leeway, it was always hard for me to ignore his really bad regular season numbers last year. He got hot at the right time, and it was hard to project if he could hold his playoff performance into the regular season.
Cam Ward: 46GP 24-14-6, 2.88GAA, 89.9SV%
The Thrashees? Well, Kari Lehtonen's final fantasy is giving out just-below-average goaltending with a statline of 51GP 25-17-8, 2.88GAA, 90.8SV%.
Unlike Hasek, who can sleep through half of his games, Kari faces a whopping 31.51 shots per game! Kari isn't carrying the team, but you can't blame him for the Thrashers inattention to defence.
Martin Brodeur - (55GP 35-15-5, 2.07GAA, 92.7%)
I've been oft-critical of Martin Brodeur, the goaltender with the golden horseshoe up his arse. While he has always piled up the big win totals and made the most out of great situations, he's rarely ever been among the true top 3 in the league in any one season. He's got a nice Vezina replica on his trophy shelf, but it wasn't really deserved.
This season? He's actually got an amazing case for the Vezina, and has truly never played better. He's second in the league with a 92.7SV%, first in shutouts with 10(!), first in wins (35), and first in GAA with 2.07.
He's faced 27.89 shots per 60 minutes, which is a much higher rate than what's he has been used to in past years, and has kept the Devils on a successful path despite many roster deletions over the past couple of seasons.
I'll give him his props, he definitely is Vezina-worthy this season.
Roberto Luongo - (54GP 32-18-3, 2.34GAA, 92.1SV%)
At the start of the season, Luongo was really struggling and was definitely not the "Luongod" we expected. Fortunately, the fans here were willing to cut him some slack (very rare for any goaltender) and supported Luongo through his adjustment period. I guess the fans (as I did) figured Luongo would find himself eventually, and he certainly did.
I don't often pump goalies for the MVP, but Luongo has a great case based on the "Most valuable to his team" argument. No goalie has faced more shots on goal this year (1553, 29.60 per 60 minutes), and no goalie has had quite the profound effect on his team, not even Brodeur. Want to know where the Canucks would be with Dan Cloutier back in net? Sniffing the Blue Jackets' asses like a dog.
---
Sometimes, the best laid plans go to waste, and a backup goalie ends up supplanting the "#1" and doing a much better job.
OTTAWA
Ray Emery: 41GP 24-13-2, 2.40GAA, 92.3SV%
Martin Gerber: 21GP 9-9-1, 2.92GAA, 90.4SV%
...and this isn't the first time Gerber has been usurped. You'd think Ottawa would have looked at Gerber's real numbers from last year before shelling out millions....
COLORADO
Peter Budaj: 35GP 17-13-3, 2.67GAA, 90.9SV%
Jose Theodore: 27GP 10-12-1, 3.30GAA, 89.2SV%
As a Canucks fan, I'm quite happy that the Colorado Avalanche were dumb enough to dress the shell-shocked Theodore so often to justify his large salary. If the Avs played Budaj more than they have, they'd likely be in a playoff spot.
---
The best true tandem? That would be the Nashville Predators. When Tomas Vokoun went down with a long-term injury earlier this season, there was much panic in the land that produces really bad "country" music.
Instead, Chris Mason came in and did an ever better job than Vokoun. Given Mason's numbers from last season, it's not a huge surprise...
Chris Mason: 33GP, 21-9-2, 2.35GAA, 92.7SV%
Tomas Vokoun: 27GP, 18-7-1, 2.38GAA, 92.1SV%
---
Who has the easiest goaltending job in the NHL? That would be Dominik "Smoker's Teeth" Hasek, who faces a measly 22.53 shots per 60 minutes. He has the very shiny wins (30), GAA (2.08), and gets a load of positive press. What the press doesn't seem to notice is his league-average 90.8SV%.
Still, the Wings are doing the smart thing by keeping Hasek from getting fatigued and tearing up his groin during the season. All the Wings need is for Hasek to 'be there' when the playoffs start.
---
Sometimes, a good offence isn't enough...
Q: What do the Carolina Hurricanes, Atlanta Thrashers, and Tampa Bay Lightning all have in common?
A: Great goal scoring and crappy goaltending! All 3 teams have littered the scoring leaderboards with offensive firepower (Whitney, St. Louis, Lecavalier, Hossa, Kovalchuk, etc...), and are struggling to achieve a great deal of success.
The Hurricanes rank 8th in goals for and 22nd in goals against.
The Lightning rank 10th in goals for 20th in goals against
The Thrashees rank 11th in goals for and 25th in goals against.
Somehow, the Tampa Bay Lightning thought that bringing in a guy who could barely handle the #1 duties for the Columbus Blue Jackets would be the solution to their goaltending problems. Huh??!?! Well, he didn't work out so well, so they got some generic Swedish guy to take over...
Marc Denis: 30GP 11-13-2, 3.15GAA, 88.0SV% (2nd worst)
Johan Holmqvist: 33GP 21-11-10, 2.64GAA, 90.1SV% (Winning despite a poor SV%)
The Carolina Hurricanes were smart to let the Sens overpay for Martin Gerber, but fooled into thinking Cam Ward could handle the #1 duties.
While his cup ring will earn Ward a LOT of leeway, it was always hard for me to ignore his really bad regular season numbers last year. He got hot at the right time, and it was hard to project if he could hold his playoff performance into the regular season.
Cam Ward: 46GP 24-14-6, 2.88GAA, 89.9SV%
The Thrashees? Well, Kari Lehtonen's final fantasy is giving out just-below-average goaltending with a statline of 51GP 25-17-8, 2.88GAA, 90.8SV%.
Unlike Hasek, who can sleep through half of his games, Kari faces a whopping 31.51 shots per game! Kari isn't carrying the team, but you can't blame him for the Thrashers inattention to defence.
Labels: Analysis, brodeur, cam ward, emery, goaltenders, hasek, Lehtonen, luongo, marc denis, opinion, statistics
Sunday, June 13, 2004
Objective Statistical Analysis - Breaking the 'Old School' Barriers
Out of all the major pro sports in North American, hockey is, by far, the most 'Old School' of sports when it comes to analysis.
When you talk about a player, scout a player, or compare two players, you generally see terms such as anticipation, hockey sense, balance, "Heart", "He comes up big in big games!" and so on. Rarely do you ever see a meaningful objective comparison or evaluation of players that isn't influenced by some sort of personal bias.
The problem? All of those traits are subjective, and cannot be objectively measured the same way by two different people. Where as I see Rob Niedermayer as a rather average skater due to his lack of first-step quickness and his apparent clumsiness, other scouts see a fast skater who can chew up ice like a sno-cone machine.
Hockey has very few resources for statistical analysis, an area which has always intrigued me. I have planned a few studies on my own, as I had seen nothing out there before. The famed book MONEYBALL: The Art of Winning an Unfair Game, showed how baseball's Oakland Athletics exploited market inefficiencies by using statistical analysis and 'non-traditional' analysis to sign players that other teams didn't value due to lacking 'The Good Face', or the 'Tools' (Speed, Power, etc), yet could perform well enough to justify a roster spot.
As Daryl Shilling put it, "Hockey lives in a completely different world than other businesses. Brokerage firms, for example, review the performances of funds and their workers scientifically, and make business decisions based on study. Hockey
bases almost every one of its decisions based purely on perception, which is
a an extremely limited method of evaluation."
Who is Daryl Shilling? Well, I was absolutely stunned and pleased to recently come across a site called The Hockey Project, where I found a very good counter-argument to my rant for Neely's HOF chances. This site is run by Daryl Shilling, and he has already developed some good studies that could really kickstart a 'Stathead' revolution in the hockey realm.
Basically, there are 2 major areas which present problems in performing objective statistical analysis, and then having said analysis accepted by the fans, media, and powers that be.
Lack of Deep, Meaningful, and Objective Data:
When you want to compare two players, say Martin St. Louis and Jerome Iginla , there isn't a lot of measures out there that can tell you a lot about the seasons they had, in context to the league around them.
From the basic stats readily available:
So, from the stats most commonly available to anyone, what can we see?
Well, St-Louis has more points, a better +/-, far less penalties, and most short-handed goals, while Iginia has more goals, more shots, and more game-winning goals.
So, can we truly conclude, from these basic stats, that St-Louis was a superior defensive player (+/- and SHG), while Iginla was more "clutch" because he scored more Game Winning Goals?
Well, most fans probably would and will conclude that from the statistics. There simply aren't details statistics available to measure defensive contribution, or other 'intangibles'.
A question? Do Short Handed Goals = great defensive play? or sacrificing defense for offense?
I ask this because, subjectively, Pavel Bure is the perfect example of racking up Short Handed Goals at the expense of defense.
Bure had 6 SHG in 97-98, and 34 in his career. From his time on the Canucks, I could say that he often 'poached' while killing penalties, looking for opportunities to score goals. For the opportunity to score shorthanded, Bure would give up attention to the defensive responsibilies that he was assigned. So, Short Handed Goals seem like a truly shaky argument for defensive ability, given the fact that the object of killing a penalty should be first and foremost to 'not get scored on'.
Unfortunately, the NHL does not keep much data that is 'deeper' than what I have provided you above. The only other statistic that I have not shown you is 'Time on Ice', where we can see that Iginla played 2:11 of shorthanded time per game compared to St-Louis' 1:36. This tells you that Iginla played more on the penalty-killing units, but it doesn't tell you who was better.
The NHL comes up 'Short Handed':
If you look at a typical hockey boxscore, you can't get very much from it (Who scored, assisted, shots, saves, penalties). Until recently, boxscores didn't even contain the player's individual +/- and Shots on Goal totals. So, if you look at a historical box score, you can't get very much at all from it other than the basic counting stats.
This is where the NHL comes in. As a custodian of the sport, the NHL has recenly gone backwards in the realm of record keeping. Just a few years ago, we were lucky enough to finally have access to statistics like hits, giveaways, takeaways, and blocked shots.
Unfortunately, the NHL stats keepers at most arenas, like NHL referees, were wildly inconsistant in their application of tabulating the numbers. Some arenas were extremely generous in giving out hits (New York), and some were extremely stingy.
When the NHLPA was brilliant enough to use stats to show the contributions of 'role' players, the NHL, in a move driven by simply pure greed, decided to stop providing these detailed stats to the public. Although the NHL was ordered to provide this information to the NHLPA, the NHL simply refuses to release these figures to the public.
So, in the end, we are left with only the basic statistics again, which makes it harder to develop meaningful measures and objective analysis.
Lack of Mainstream Acceptance:
I am sure some of you are reading this and thinking, "What a nerd, this guy has never played the game and he thinks you can know a player just by looking at some spreadsheets!"
This type of attitude is rampant among baseball scouts and executives, despite the inroads of statistical analysis into many front offices in that sport.
Why is it so hard for 'Old School' types, and mainstream media and fans to accept objective studies?
1. It's too 'hard' for them - People tend to fear and dislike things that they don't understand. I don't tend to like nuclear physics because it's just generally too much for my head to wrap around, and 'Old School' hockey types don't tend to be the brightest lights in the chandalier.
Hockey people tend to know and understand the 'basic' stats like goals, assists, and ice-time. If you try to present some sort of basic formula to them, they will likely have trouble understanding it, and will fight it because it could be a threat to them. (Some baseball teams have drastically reduced scouting departments because they could use analysis to draft players for a much cheaper price).
2. "You never played the game" - It's a strange phenomenon in the sporting world where the league's top executives tend to be former players and coaches. Rarely is a hockey business run by a professional businessman, but rather by one of the 'boys'. The Edmonton Oilers are the perfect example of this, as the team is run by Kevin Lowe, who was very recently a coach and NHL player himself.
The Hockey Realm is a very closed group, and they don't tend to look favourably upon 'outsiders' telling them what to do. Unless you 'Played the Game', these guys tend to think that you couldn't possibly understand the game.
To them, I ask them this: If you never practiced politics, or ran for public office, does that mean you cannot have an expert opinion on political issues?
As for the media, they tend to repeat and regurgigitate the same old tried-and-not-so-true cliches. Their mentality matches that of the 'Old School', so the mainsteam media tend to look at objective analysis with a "King of the Mountain" mentality.
3. It's Boring - One barrier to objective analysis is presenting it in a format that people can understand, and that people will want to read it!
I could post pages of very useful information, but if it's poorly formatted and explained, people will not want to read it, nor come out of reading it with an understand of just what I want to explain to them.

When I perform some studies in the future, I hope to do so in a format that is 'easy to read' and 'entertaining' at the same time. You are more likely to accept a new idea if it at least intrigues you in some way, even if it comes down to me posting photos of Anna Kournikova.
Yeah, that got your attention, didn't it???
When you talk about a player, scout a player, or compare two players, you generally see terms such as anticipation, hockey sense, balance, "Heart", "He comes up big in big games!" and so on. Rarely do you ever see a meaningful objective comparison or evaluation of players that isn't influenced by some sort of personal bias.
The problem? All of those traits are subjective, and cannot be objectively measured the same way by two different people. Where as I see Rob Niedermayer as a rather average skater due to his lack of first-step quickness and his apparent clumsiness, other scouts see a fast skater who can chew up ice like a sno-cone machine.
Hockey has very few resources for statistical analysis, an area which has always intrigued me. I have planned a few studies on my own, as I had seen nothing out there before. The famed book MONEYBALL: The Art of Winning an Unfair Game, showed how baseball's Oakland Athletics exploited market inefficiencies by using statistical analysis and 'non-traditional' analysis to sign players that other teams didn't value due to lacking 'The Good Face', or the 'Tools' (Speed, Power, etc), yet could perform well enough to justify a roster spot.
As Daryl Shilling put it, "Hockey lives in a completely different world than other businesses. Brokerage firms, for example, review the performances of funds and their workers scientifically, and make business decisions based on study. Hockey
bases almost every one of its decisions based purely on perception, which is
a an extremely limited method of evaluation."
Who is Daryl Shilling? Well, I was absolutely stunned and pleased to recently come across a site called The Hockey Project, where I found a very good counter-argument to my rant for Neely's HOF chances. This site is run by Daryl Shilling, and he has already developed some good studies that could really kickstart a 'Stathead' revolution in the hockey realm.
The Roadblocks to Objective Analysis:
Basically, there are 2 major areas which present problems in performing objective statistical analysis, and then having said analysis accepted by the fans, media, and powers that be.
Lack of Deep, Meaningful, and Objective Data:
When you want to compare two players, say Martin St. Louis and Jerome Iginla , there isn't a lot of measures out there that can tell you a lot about the seasons they had, in context to the league around them.
From the basic stats readily available:
St. Louis - GP G  A Pts +/- PIM Shots  Sh% GWG GTG SHG SHA PPG PPA
            82 38 56 94 +35 24    212 17.92 7   0   8   3   8   22


Iginla -    GP G  A Pts +/- PIM Shots  Sh% GWG GTG SHG SHA PPG PPA
            81 41 32 73 +21 84    265 15.47 10  1   4   1   8   13
So, from the stats most commonly available to anyone, what can we see?
Well, St-Louis has more points, a better +/-, far less penalties, and most short-handed goals, while Iginia has more goals, more shots, and more game-winning goals.
So, can we truly conclude, from these basic stats, that St-Louis was a superior defensive player (+/- and SHG), while Iginla was more "clutch" because he scored more Game Winning Goals?
Well, most fans probably would and will conclude that from the statistics. There simply aren't details statistics available to measure defensive contribution, or other 'intangibles'.
A question? Do Short Handed Goals = great defensive play? or sacrificing defense for offense?
I ask this because, subjectively, Pavel Bure is the perfect example of racking up Short Handed Goals at the expense of defense.
Bure had 6 SHG in 97-98, and 34 in his career. From his time on the Canucks, I could say that he often 'poached' while killing penalties, looking for opportunities to score goals. For the opportunity to score shorthanded, Bure would give up attention to the defensive responsibilies that he was assigned. So, Short Handed Goals seem like a truly shaky argument for defensive ability, given the fact that the object of killing a penalty should be first and foremost to 'not get scored on'.
Unfortunately, the NHL does not keep much data that is 'deeper' than what I have provided you above. The only other statistic that I have not shown you is 'Time on Ice', where we can see that Iginla played 2:11 of shorthanded time per game compared to St-Louis' 1:36. This tells you that Iginla played more on the penalty-killing units, but it doesn't tell you who was better.
The NHL comes up 'Short Handed':
If you look at a typical hockey boxscore, you can't get very much from it (Who scored, assisted, shots, saves, penalties). Until recently, boxscores didn't even contain the player's individual +/- and Shots on Goal totals. So, if you look at a historical box score, you can't get very much at all from it other than the basic counting stats.
This is where the NHL comes in. As a custodian of the sport, the NHL has recenly gone backwards in the realm of record keeping. Just a few years ago, we were lucky enough to finally have access to statistics like hits, giveaways, takeaways, and blocked shots.
Unfortunately, the NHL stats keepers at most arenas, like NHL referees, were wildly inconsistant in their application of tabulating the numbers. Some arenas were extremely generous in giving out hits (New York), and some were extremely stingy.
When the NHLPA was brilliant enough to use stats to show the contributions of 'role' players, the NHL, in a move driven by simply pure greed, decided to stop providing these detailed stats to the public. Although the NHL was ordered to provide this information to the NHLPA, the NHL simply refuses to release these figures to the public.
So, in the end, we are left with only the basic statistics again, which makes it harder to develop meaningful measures and objective analysis.
Lack of Mainstream Acceptance:
I am sure some of you are reading this and thinking, "What a nerd, this guy has never played the game and he thinks you can know a player just by looking at some spreadsheets!"
This type of attitude is rampant among baseball scouts and executives, despite the inroads of statistical analysis into many front offices in that sport.
Why is it so hard for 'Old School' types, and mainstream media and fans to accept objective studies?
1. It's too 'hard' for them - People tend to fear and dislike things that they don't understand. I don't tend to like nuclear physics because it's just generally too much for my head to wrap around, and 'Old School' hockey types don't tend to be the brightest lights in the chandalier.
Hockey people tend to know and understand the 'basic' stats like goals, assists, and ice-time. If you try to present some sort of basic formula to them, they will likely have trouble understanding it, and will fight it because it could be a threat to them. (Some baseball teams have drastically reduced scouting departments because they could use analysis to draft players for a much cheaper price).
2. "You never played the game" - It's a strange phenomenon in the sporting world where the league's top executives tend to be former players and coaches. Rarely is a hockey business run by a professional businessman, but rather by one of the 'boys'. The Edmonton Oilers are the perfect example of this, as the team is run by Kevin Lowe, who was very recently a coach and NHL player himself.
The Hockey Realm is a very closed group, and they don't tend to look favourably upon 'outsiders' telling them what to do. Unless you 'Played the Game', these guys tend to think that you couldn't possibly understand the game.
To them, I ask them this: If you never practiced politics, or ran for public office, does that mean you cannot have an expert opinion on political issues?
As for the media, they tend to repeat and regurgigitate the same old tried-and-not-so-true cliches. Their mentality matches that of the 'Old School', so the mainsteam media tend to look at objective analysis with a "King of the Mountain" mentality.
3. It's Boring - One barrier to objective analysis is presenting it in a format that people can understand, and that people will want to read it!
I could post pages of very useful information, but if it's poorly formatted and explained, people will not want to read it, nor come out of reading it with an understand of just what I want to explain to them.
When I perform some studies in the future, I hope to do so in a format that is 'easy to read' and 'entertaining' at the same time. You are more likely to accept a new idea if it at least intrigues you in some way, even if it comes down to me posting photos of Anna Kournikova.
Yeah, that got your attention, didn't it???
Labels: Analysis, Iginla, opinion, statistics