
Thursday, June 23, 2005
A Hockey Rants Study: 2003/04 NHL Pythagorean Standings
I once bemoaned the lack of statistical analysis in a previous essay/post, and now it's time for me to explore this area in a little more detail.
Let's start off with something very easy to understand concept in what we call Pythagorean Standings aka Expected Win %.
Developed by baseball writer and pioneer Bill James, Pythagorean Winning Percentage is an estimate of a team's winning percentage given their goals scored and goals allowed.
You would expect a team that scored 200 goals for and let in 200 goals against within a single season to be a .500 team, right?
Real life, of course, doesn't always quite work out that way. A team could end up 10 games over .500 with an even goal differential. When looking at Pythagorean standings, we tend to attribute this to 'luck'. Over a long season, what factors contribute to teams doing better or worse than their record 'should' be?
In terms of practical use, we do know (from many baseball evaluations) that teams will tend to 'regress to the mean' in follow seasons. Say you have a very 'lucky' team that won 10 games more than they should have. All things being equal (minimal roster changes and other factors), you would expect that team to do worse next season based on the natural Plexiglass Principle. This works as well for teams that were 'unlucky'.
So, when you evaluate how your team did during one individual season, and look to what may happen next season, it could be a good idea to see if the team will likely get better or worse simply by the Plexiglass Principle.
There were a few problems/difference to sort out between the baseball method and the hockey method
1. Hockey games end in ties. A team could never win and never lose a game (All ties) and end up as a .500 team (0-0-82). This doesn't skew the overall numbers much (since such a team gets as many points as a team tht goes 41-41-0), but certain teams can be very good at tying up games while others either win/lose...which leads to...
2. Not all games are created equal. With the advent of the Overtime Loss bonus point, not every NHL game is equal. A 1-1 tie is worth 2 points, a 3-0 win is worth 2 points, but a 2-1 OT win is worth 3 points! I calculated the average NHL game to be worth 2.12 points last year, and this had to be accounted for in my calculations.
Now, I present the 2003/04 NHL Overall Pythagorean Standings.
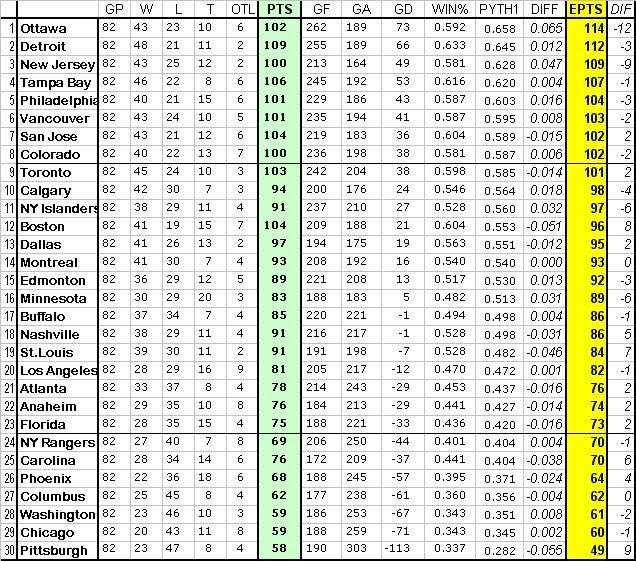
You can see the team's Actual Points, 'Expected' points, goal differentials, and how unlucky/lucky they were (In other words, how did they do against their expected Win %)
The Lucky Ones:
+9 Pittsburgh -> Very poor teams will tend to have big deviations from their expected Win%. Why? Well, the Penguins were likely down 3-0 or 4-0 after 2 periods in many of their games. You can imagine that when you are down by a large score, and play on a crappy team that loses many games, you are not going to play with a lot of confidence and will likely be involved in many lopsided losses. While the Penguinos won their share of games, most of them were probably by close scores...while many of their losses would have been lopsided.
+8 Boston -> Boston was an amazing story in 2003/04 as they were the only NHL team to lose less than 20 games! Boston did this with a very young goaltender, a rather shaky defence corps, and a heavy reliance on one line to do the scoring (Thornton-Knuble-Murray). Boston 'should' have finished 12 with their goal differential, but managed to place 5th overall! You wouldn't expect them to have the same great performance given their defence and I know most people were surprised that Boston finished so well.
+7 St. Louis -> The Blues top-heavy roster (a massive drop-off after Demitra, Weight, Tkachuk, Pronger, Jackman, and Mellanby), injuries (MacInnis) and goaltending woes led them to a season where they actually had a negative goal differential. Despite this, the Blues managed to squeak into the playoffs and finished with a .528 Win%. The Blues can certainly thank their lucky stars (but not the Dallas Stars) that they made the playoffs when they really didn't deserve to, based on their play. With an aging roster, and the departures of MacInnis and Demitra, the Blues are poised for a big fall.
+6 Carolina -> The most unlucky lucky team. Carolina actually placed better than expected, which is no prize in itself. If the Canes did as poorly as they should have, then they would have been lined up for a better draft position! Everything turns to crap for this franchise, doesn't it?
+5 Nashville -> Similar to St. Louis in that the Preds had a lackluster GF/GA and still made the playoffs over Minnesota (more on them in a second). If the young Preds can keep improving, they will likely match the 91 points they earned in 2003/04 and not suffer a setback to their established mean.
The Unlucky Ones
-12 Ottawa Senators -> The Senators have a deep and talented roster, and many writers and fans considered their 2003/04 performance to be a dissappointment. According to expected Win%, the Senators played like a much better team than the real standings would indicate. If the Senators can get a goalie 'upgrade' from Dominik Hasek, the Senators would expected to do monstrous things next season.
-9 New Jersey Devils -> Martin Brodeur and the boring Devils keep the GA total down with their amazing defensive play and murder of offensive hockey. I haven't looked at previous seasons' Pythag win% yet, but I would guess that an ultra-defensive team like the Devils would tend to deviate a lot based on their nature to play in tight defensive hockey games, even when they are leading 1-0 just 3 minutes into the first period.
-6 Minnesota -> These are truly the 'unlucky' ones, although I doubt many people will feel sorry for one of the NHL's other anti-hockey teams. According to Expected Win%, Minnesota should have made the playoffs over both St. Louis AND Nashville. Again, a tight defensive team deviates greatly from the expected %'s
-6 New York Islanders -> I'm not sure how to explain their deviation, other than the fact that their goaltending is quite poor with the inexperienced DiPietro and the sluggish Garth Snow tending the twine (especially Snow and his .899 SV%).
-3 Edmonton Oilers -> Finally, we finish with the Oilers. Like the Wild, the Oilers were 'expected' to make the playoffs based on their performance, but their unluckyness, combined with the Preds and Blues luck, caused them to watch the NHL Playoffs at home. The Oilers didn't really deviate much from their expected record, but there was enough deviation on both sides for the Oilers to miss the playoffs by 2 measly points!!
The remaining teams tend to fall within a 2-3 point range of their expected standings. These small deviations represent a win or two, and really don't mean much since these teams performance quite closely to their expected records. When evaluating Pythag Win%, it's the major deviations which merit attention. If we had an NHL season the past few months, we could have expected the Blues to fall on rough times and perhaps end their playoffs-made record, the Senators to rule the NHL with 120 points, and Boston to fall on rougher times.
'Expected' is always the key word, and we know that only the REAL standings count. Despite this, I feel Pythag Win% can be a useful tool when analysing how certain teams would be expected to do next season when doing predictions, and when projecting the future performance of your favourite team. If I were a GM of any of the very unlucky/lucky teams I talked about above, I would definitely account for the Plexiglass Principle when making my offseason moves and signings.
This was a very simple exercise, and I hope it helps increase your knowledge and interest in some basic statisical metrics when it comes to the game of hockey. We still have a long way to go, but I suggest you go and visit Daryl Shilling's The Hockey Project if you want to look at many other fine studies.
Let's start off with something very easy to understand concept in what we call Pythagorean Standings aka Expected Win %.
Developed by baseball writer and pioneer Bill James, Pythagorean Winning Percentage is an estimate of a team's winning percentage given their goals scored and goals allowed.
You would expect a team that scored 200 goals for and let in 200 goals against within a single season to be a .500 team, right?
Real life, of course, doesn't always quite work out that way. A team could end up 10 games over .500 with an even goal differential. When looking at Pythagorean standings, we tend to attribute this to 'luck'. Over a long season, what factors contribute to teams doing better or worse than their record 'should' be?
In terms of practical use, we do know (from many baseball evaluations) that teams will tend to 'regress to the mean' in follow seasons. Say you have a very 'lucky' team that won 10 games more than they should have. All things being equal (minimal roster changes and other factors), you would expect that team to do worse next season based on the natural Plexiglass Principle. This works as well for teams that were 'unlucky'.
So, when you evaluate how your team did during one individual season, and look to what may happen next season, it could be a good idea to see if the team will likely get better or worse simply by the Plexiglass Principle.
There were a few problems/difference to sort out between the baseball method and the hockey method
1. Hockey games end in ties. A team could never win and never lose a game (All ties) and end up as a .500 team (0-0-82). This doesn't skew the overall numbers much (since such a team gets as many points as a team tht goes 41-41-0), but certain teams can be very good at tying up games while others either win/lose...which leads to...
2. Not all games are created equal. With the advent of the Overtime Loss bonus point, not every NHL game is equal. A 1-1 tie is worth 2 points, a 3-0 win is worth 2 points, but a 2-1 OT win is worth 3 points! I calculated the average NHL game to be worth 2.12 points last year, and this had to be accounted for in my calculations.
Now, I present the 2003/04 NHL Overall Pythagorean Standings.
You can see the team's Actual Points, 'Expected' points, goal differentials, and how unlucky/lucky they were (In other words, how did they do against their expected Win %)
The Lucky Ones:
+9 Pittsburgh -> Very poor teams will tend to have big deviations from their expected Win%. Why? Well, the Penguins were likely down 3-0 or 4-0 after 2 periods in many of their games. You can imagine that when you are down by a large score, and play on a crappy team that loses many games, you are not going to play with a lot of confidence and will likely be involved in many lopsided losses. While the Penguinos won their share of games, most of them were probably by close scores...while many of their losses would have been lopsided.
+8 Boston -> Boston was an amazing story in 2003/04 as they were the only NHL team to lose less than 20 games! Boston did this with a very young goaltender, a rather shaky defence corps, and a heavy reliance on one line to do the scoring (Thornton-Knuble-Murray). Boston 'should' have finished 12 with their goal differential, but managed to place 5th overall! You wouldn't expect them to have the same great performance given their defence and I know most people were surprised that Boston finished so well.
+7 St. Louis -> The Blues top-heavy roster (a massive drop-off after Demitra, Weight, Tkachuk, Pronger, Jackman, and Mellanby), injuries (MacInnis) and goaltending woes led them to a season where they actually had a negative goal differential. Despite this, the Blues managed to squeak into the playoffs and finished with a .528 Win%. The Blues can certainly thank their lucky stars (but not the Dallas Stars) that they made the playoffs when they really didn't deserve to, based on their play. With an aging roster, and the departures of MacInnis and Demitra, the Blues are poised for a big fall.
+6 Carolina -> The most unlucky lucky team. Carolina actually placed better than expected, which is no prize in itself. If the Canes did as poorly as they should have, then they would have been lined up for a better draft position! Everything turns to crap for this franchise, doesn't it?
+5 Nashville -> Similar to St. Louis in that the Preds had a lackluster GF/GA and still made the playoffs over Minnesota (more on them in a second). If the young Preds can keep improving, they will likely match the 91 points they earned in 2003/04 and not suffer a setback to their established mean.
The Unlucky Ones
-12 Ottawa Senators -> The Senators have a deep and talented roster, and many writers and fans considered their 2003/04 performance to be a dissappointment. According to expected Win%, the Senators played like a much better team than the real standings would indicate. If the Senators can get a goalie 'upgrade' from Dominik Hasek, the Senators would expected to do monstrous things next season.
-9 New Jersey Devils -> Martin Brodeur and the boring Devils keep the GA total down with their amazing defensive play and murder of offensive hockey. I haven't looked at previous seasons' Pythag win% yet, but I would guess that an ultra-defensive team like the Devils would tend to deviate a lot based on their nature to play in tight defensive hockey games, even when they are leading 1-0 just 3 minutes into the first period.
-6 Minnesota -> These are truly the 'unlucky' ones, although I doubt many people will feel sorry for one of the NHL's other anti-hockey teams. According to Expected Win%, Minnesota should have made the playoffs over both St. Louis AND Nashville. Again, a tight defensive team deviates greatly from the expected %'s
-6 New York Islanders -> I'm not sure how to explain their deviation, other than the fact that their goaltending is quite poor with the inexperienced DiPietro and the sluggish Garth Snow tending the twine (especially Snow and his .899 SV%).
-3 Edmonton Oilers -> Finally, we finish with the Oilers. Like the Wild, the Oilers were 'expected' to make the playoffs based on their performance, but their unluckyness, combined with the Preds and Blues luck, caused them to watch the NHL Playoffs at home. The Oilers didn't really deviate much from their expected record, but there was enough deviation on both sides for the Oilers to miss the playoffs by 2 measly points!!
The remaining teams tend to fall within a 2-3 point range of their expected standings. These small deviations represent a win or two, and really don't mean much since these teams performance quite closely to their expected records. When evaluating Pythag Win%, it's the major deviations which merit attention. If we had an NHL season the past few months, we could have expected the Blues to fall on rough times and perhaps end their playoffs-made record, the Senators to rule the NHL with 120 points, and Boston to fall on rougher times.
'Expected' is always the key word, and we know that only the REAL standings count. Despite this, I feel Pythag Win% can be a useful tool when analysing how certain teams would be expected to do next season when doing predictions, and when projecting the future performance of your favourite team. If I were a GM of any of the very unlucky/lucky teams I talked about above, I would definitely account for the Plexiglass Principle when making my offseason moves and signings.
This was a very simple exercise, and I hope it helps increase your knowledge and interest in some basic statisical metrics when it comes to the game of hockey. We still have a long way to go, but I suggest you go and visit Daryl Shilling's The Hockey Project if you want to look at many other fine studies.
Comments:
<< Home
I've been wanting to analyze hockey this way since I read Moneyball but never had the diligence to actually do it, so thanks for checking it out!
# posted by  : 9:00 am
: 9:00 am
This is great. Studies like this will be very useful as I work on my hockey league simulator (http://spaces.msn.com/members/GlobalHockey).

What did you use for an exponent? Did you use one of James' Numbers: 2 or 1.81?
# posted by : 4:11 pm
: 4:11 pm
I used the 2.00 instead of 1.81
I found a bit more precision with the 2.00 IIRC (It's been awhile since I played with the tables), and less rounding error.
Post a Comment
I found a bit more precision with the 2.00 IIRC (It's been awhile since I played with the tables), and less rounding error.
<< Home
![]()